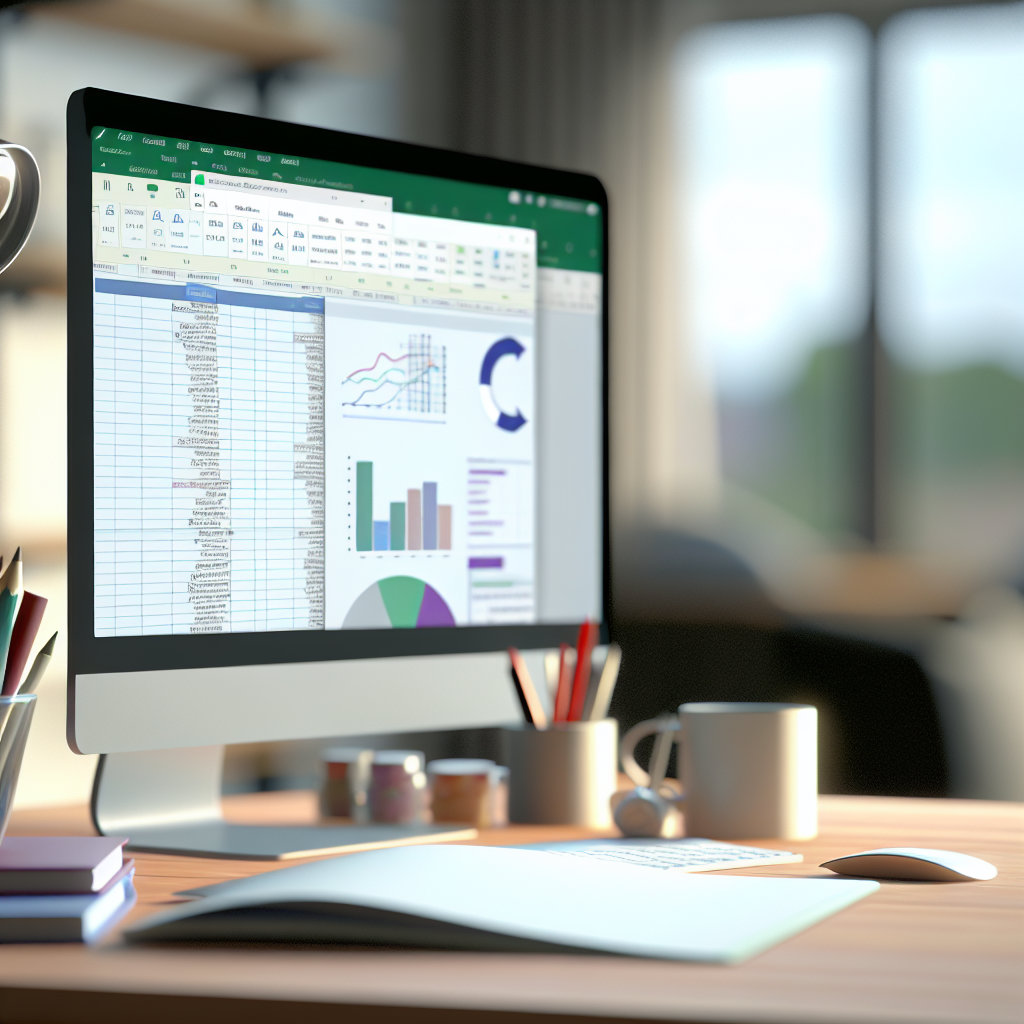
Creating a dynamic dashboard in Excel can be time-consuming and complex, especially for those without extensive coding experience. However, with the power of ChatGPT, you can now build a **ONE CLICK Excel Dashboard** that simplifies data visualization and reporting. In this article, I’ll guide you through the process of leveraging ChatGPT to automate dashboard creation with just a single click.
Transforming Data with ChatGPT: From Concept to Automation
Initially, the challenge lies in translating raw data into an insightful dashboard. ChatGPT acts as your intelligent assistant, helping you craft **customized Excel formulas, VBA macros, and data organization strategies**. By inputting your dataset into ChatGPT, you can generate tailored code snippets that automate data processing tasks, such as summarizing sales figures, creating pivot tables, or calculating key performance indicators (KPIs).
For example, if you’re working with sales data across multiple regions, ChatGPT can help you generate a script to automate the creation of regional totals, identify trends, and prepare charts—all embedded seamlessly into your Excel file. This simplifies what traditionally takes hours of manual work into a streamlined process. Once the code is generated, you only need to run it with a single click, transforming your raw data into a professional dashboard instantly.
Building a ONE CLICK Dashboard: Step-by-Step Workflow
To develop a one-click dashboard, start by clearly defining the metrics and visuals you want to display. Use ChatGPT to generate VBA macros or Power Query steps that set up your data model and visual elements automatically. Here’s a simplified workflow:
- Data Preparation: Use ChatGPT to create scripts that automatically clean, organize, and update your dataset.
- Automation Coding: Generate VBA code that consolidates data processing, chart creation, and layout formatting.
- Embedding the Macro: Assign the generated macro to a button placed prominently on your dashboard sheet.
- Single Click Execution: With a click of the button, all processes—from data refresh to visual updates—occur in seconds, providing an up-to-date, interactive dashboard.
This approach replaces tedious manual tasks with a simple, efficient solution, allowing you to focus more on insights than on technical setup.
Conclusion
By harnessing ChatGPT’s capabilities, you can transform the way you build dashboards in Excel, creating a **ONE CLICK solution** that saves time and boosts productivity. From generating custom code snippets to automating data processing and visualization, this method empowers you to deliver real-time insights effortlessly. Embrace this innovative approach and elevate your data analysis workflow today.
