Are you looking to supercharge your data analysis in Excel? The Quick Analysis Tool is a game-changer that allows you to analyze data in a flash with just a few clicks. In this article, we’ll explore how this powerful feature can streamline your workflow, along with essential Excel shortcuts to boost your productivity.
Understanding the Quick Analysis Tool in Excel
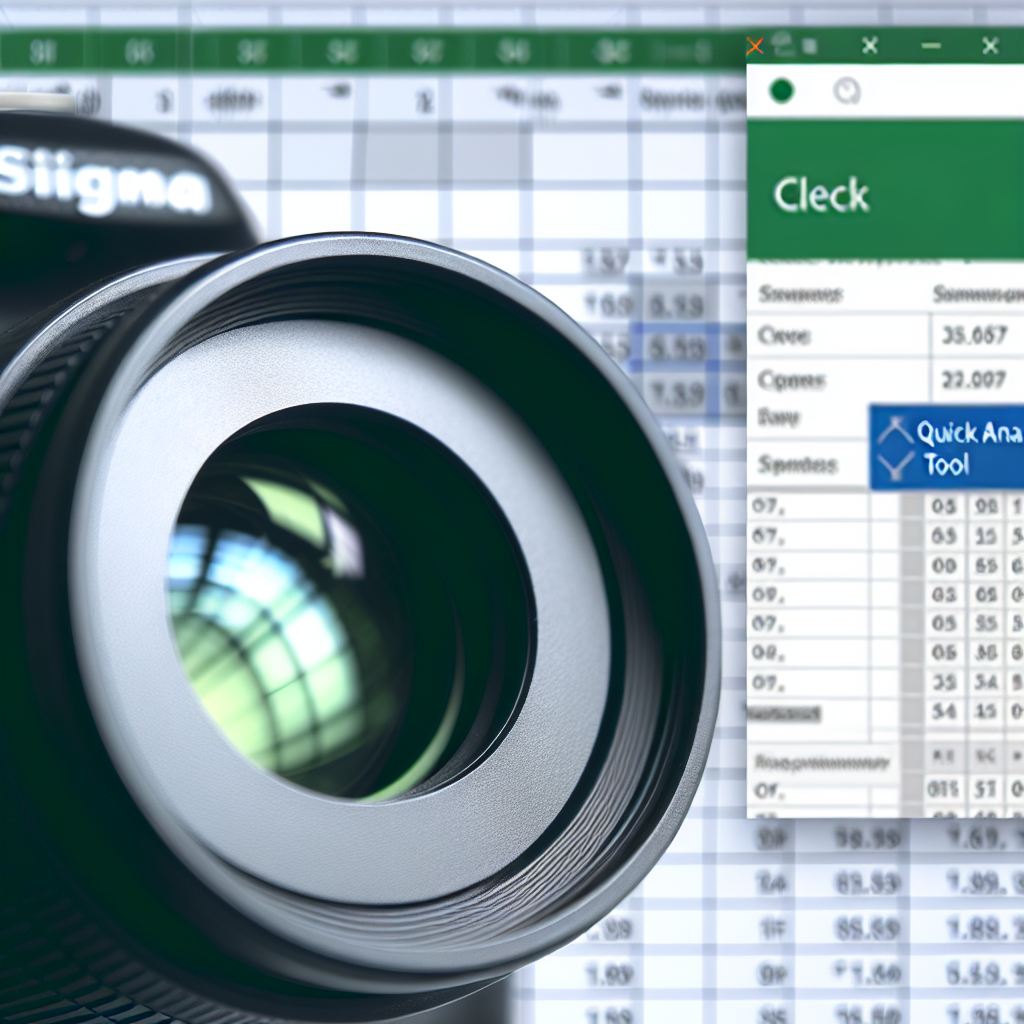
The Quick Analysis Tool is a built-in feature in recent versions of Excel that simplifies the process of generating insights from your data. Instead of navigating through multiple menus, users can select a range of data and instantly access visualizations, summaries, and formatting options. This feature is especially beneficial for those who need rapid analysis without deep diving into complex functions.
To activate it, simply select your data range, and a small icon will appear at the bottom right corner of the selection. Clicking on this icon opens a menu with various options, including Chart, Totals, Tables, and Sparklines. These options enable you to create bar graphs, pie charts, trendlines, or summaries like averages and counts — all in just a few clicks.
Utilizing the Quick Analysis Tool can save time during data presentations or when performing preliminary data checks. It encourages a more interactive and efficient approach to data analysis, making it a vital tool for professionals seeking to analyze data in a flash.
Excel Shortcuts to Accelerate Data Analysis
Beyond the Quick Analysis Tool, mastering essential Excel shortcuts can dramatically improve your efficiency. Here are some key shortcuts to incorporate into your workflow:
- Ctrl + Q: Open the Quick Analysis Tool directly, enabling instant access to analysis options.
- Ctrl + T: Create a table from selected data, which enhances sorting, filtering, and formatting capabilities.
- Alt + N + V: Insert a PivotTable to summarize large data sets quickly.
- Ctrl + Shift + 7: Apply a border to selected cells, making data easier to read visually.
- F4: Repeat the last action, saving time on repetitive formatting or calculations.
Learning and using these shortcuts in tandem with the Quick Analysis Tool will make your data analysis process faster and more accurate. They help you maximize Excel’s potential, allowing you to analyze data in a flash while focusing more on insights rather than navigation.
Conclusion
In summary, the Quick Analysis Tool in Excel is a must-have feature for anyone aiming to analyze data quickly and efficiently. When combined with key shortcuts like Ctrl + Q and Ctrl + T, you can streamline your workflow and make data-driven decisions faster. Embrace these tools to elevate your Excel skills and analyze data in a flash!